Reanalysis and Water Level data
- NCEP-NCAR North American Regional Reanalysis (NARR) at a resolution of ~32 km (0.3 degrees at the lowest latitude) was used for training and evaluating the model.
- The first figure below illustrates the partitioning of data for training and testing (also known as independent data).
- The model was also trained with CFSR data over the same period to measure analysis uncertainty.
- The zonal (U) and meridional (V) winds at 10-m above sea level and sea-level pressure (PSL) were available in 3-hourly increments starting from 1979-2012.
- Only data between the months of October 1 to March 31 was used of each year to primarily capture storm surges generated by cool-season extra-tropical cyclones.
- Raw-sea level data for Montauk and Battery Park in New York and Atlantic City in New Jersey was obtained from NOAA Tides and Currents (http://tidesandcurrents.noaa.gov/) in hourly increments between January 1, 1979 to December 31, 2012.
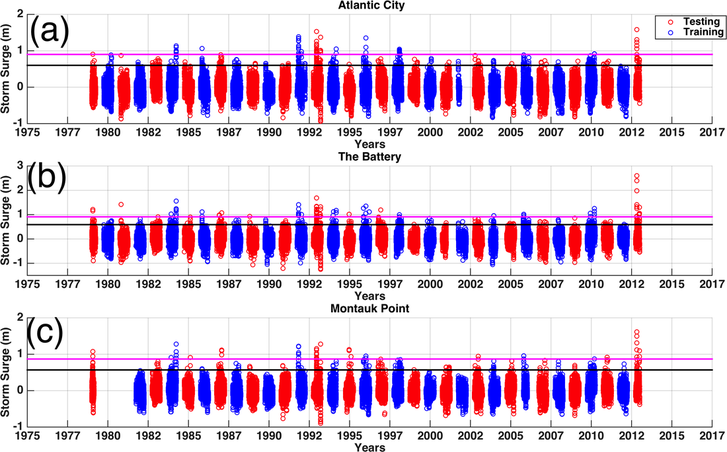
Fig 1: shows the partitioning of data for training and testing.
Regression Basics
- A regression is a statistical process for estimating the relationships between variables.
- In a univariate regression analysis, there are a set of predictor variables (termed predictors/covariates) that are hypothesized to influence a single response variable called a predictand.
- Regression techniques attempt to quantify these relationships through two primary methods: least-squares or maximum likelihood.
- This work utilizes ordinary least squares (OLS).
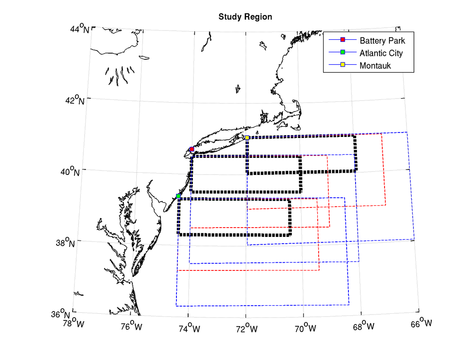
Choosing Spatial Regions
|
|
Predictors
|
1a) 10-m reanalysis winds were spatially averaged for every 3-hour interval.
1b) The minimum of the MSLP of the DCA for every 3-interval was recorded. This represented the proximity of the low to the station. 2.)The wind components were converted to wind stress components following (Garratt 1977). 3.) A moving sum of both the spatially averaged U and V extending to 24 hours was created. The moving sum which featured the largest correlation with storm surge was chosen as a predictor (Eq. 1). 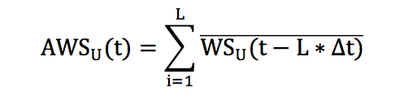
The above equation depicts the temporal summing of the orthogonal wind stresses. The subscript U representing the wind component and L the length of the moving sum in data intervals (i.e. 3 h) for the data's time step (deltaT).
All possible combinations of box size and moving sum lengths for both the meridional and zonal wind stress were taken into account by measuring the Akaike Information Criterion or AIC (Akaike 1974). |
Training & Testing (Cross-validation)
- An alternating cool seasons approach was utilized for training and cross-validation purposes (see Fig. 1).
- This was utilized to diminish biases on the water-levels due to intra-decadal variability.
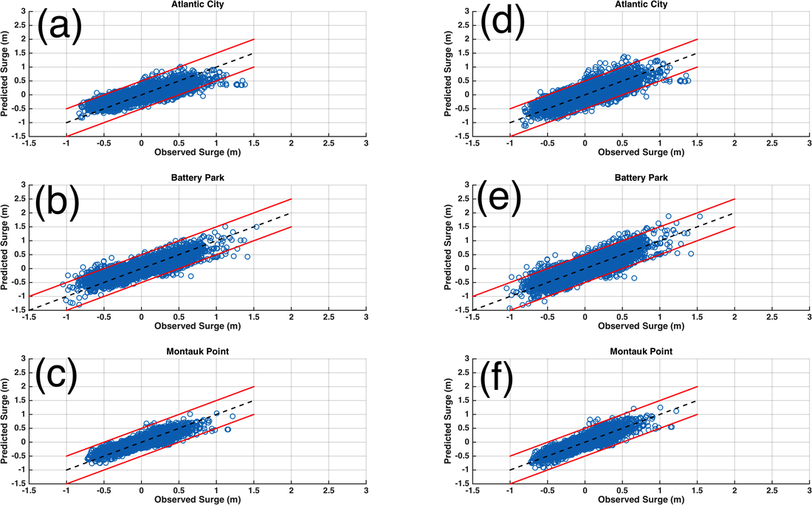
- An underprediction bias was evident in the tails of the storm surge distribution.
- To remedy this, predictions of storm surge were multiplied by the reciprocal of the training R (model correlation coefficient). The bias corrected predictions are shown on the right column.
- This decreases the total variance explained by the model, but improves the representation in the tails of the storm surge distribution (Pore et al. 1974; Klein et al. 1959).
Evaluation of Models
- Storm surge predictions were evaluated by measuring the mean absolute error and mean error when peak storm surge predictions fell within a range or bin of storm surge levels.
- Only the bias-corrected results are shown below.
- Errorbars represent the range of error scores in different configurations of data.
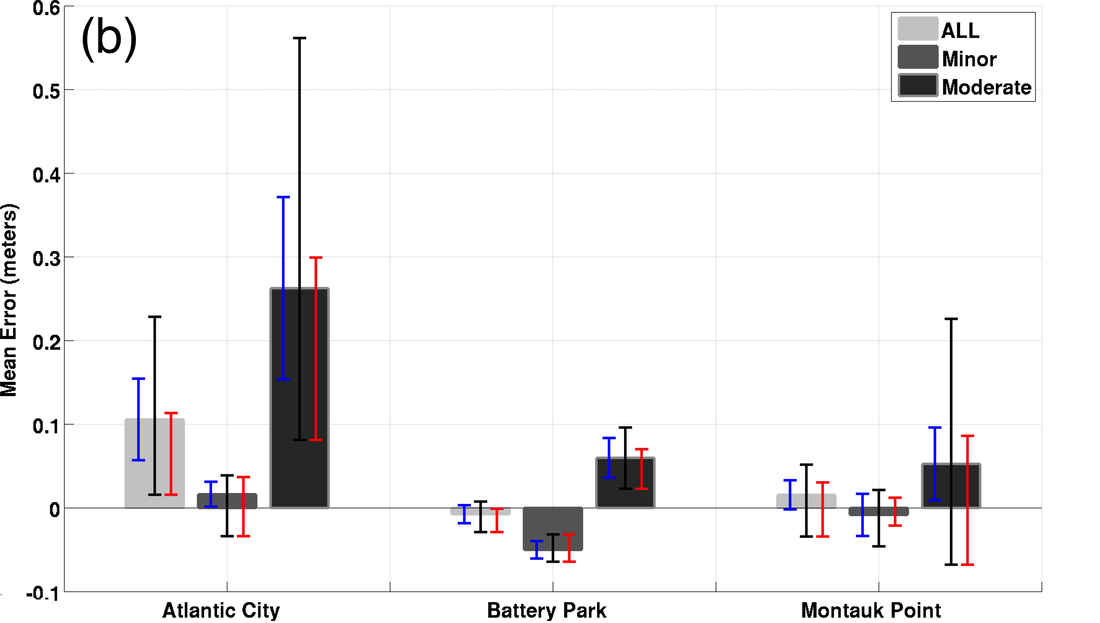
Shows the binned mean error (ME) for an independent set of data.
- Red bars depict the range of errors using different analysis (CFSR) data.
- Blue bars represent the range of errors using different cross-validation periods.
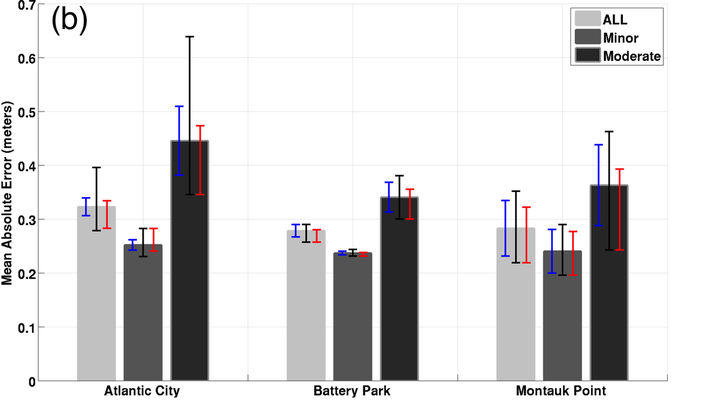
Shows the binned mean absolute error (MAE) using independent data.
- Red bars depict the range of errors using different analysis (CFSR) data.
- Blue bars represent the range of errors using different cross-validation periods.
